Key points
- While growth assets like shares go through bouts of short- term underperformance versus bonds and cash, they provide superior long-term returns. So, it makes sense that superannuation has a high exposure to them.
- The best approach is to simply recognise that occasional sharp falls in share markets and hence super funds are normal and that investing in both is a long-term investment.
Introduction
“Aussie share market loses $100bn in bloodbath”
Two weeks ago, there were lots of headlines like that after share markets fell sharply in response to US recession fears. But such headlines are nothing new. After such falls, the usual questions are: What caused the fall? What’s the outlook? And what does it mean for superannuation? The correct answer to the latter should be something like: “Nothing really, as super is a long-term investment and share market volatility is normal”.
But that can seem like marketing spin. However, the reality is that - except for those who are into trading - shares and superannuation really are long-term investments. Here’s why.
Super funds, shares & the power of compound interest
Superannuation seeks to provide maximum risk-adjusted funds, within reason, for use in retirement. So typical super funds have a bias towards shares and other growth assets, and some exposure to defensive assets like bonds and cash in order to avoid excessive short-term volatility. This approach seeks to take advantage of the power of compound interest. The next chart shows the value of a $100 investment in Australian cash, bonds, shares and residential property from 1926 assuming any interest, dividends and rents are reinvested on the way, and their annual returns. As return series for commercial property and infrastructure only go back a few decades I have used residential property as a proxy.
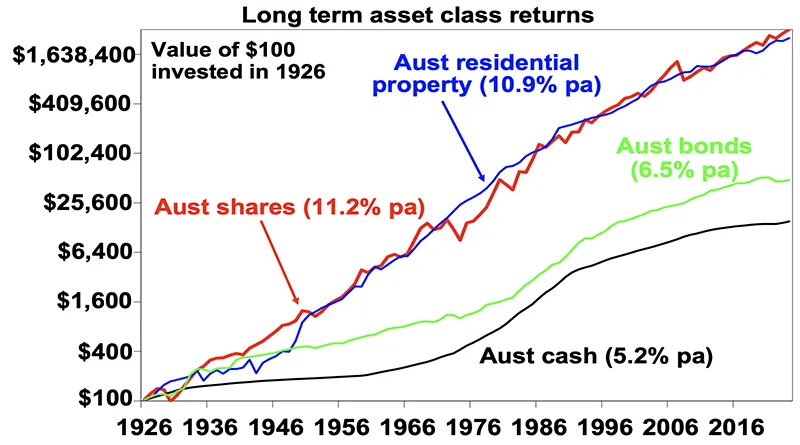
Source: ASX, Bloomberg, RBA, REIA, AMP
Because shares and property provide higher returns over long periods the value of an investment in them compounds to a much higher amount over time. So, it makes sense to have a decent exposure to them. The higher return from shares and other growth assets reflects compensation for their greater risk (seen in volatility & illiquidity) versus cash & bonds.
But investors don’t have 100 years?
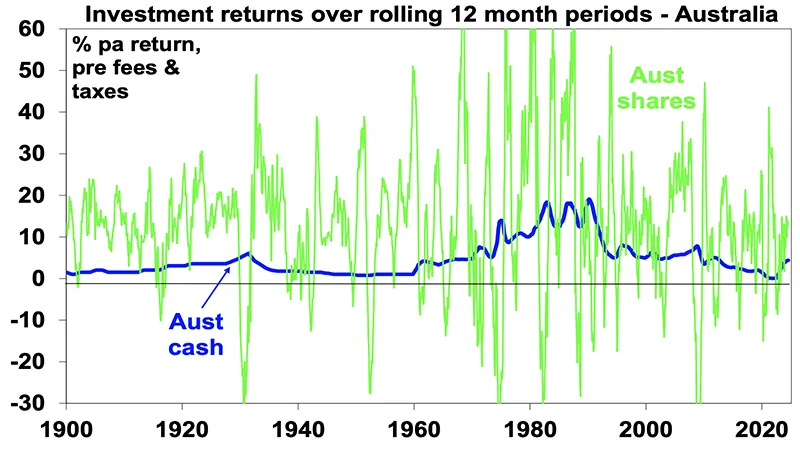
Of course, we don’t have one hundred years to save for retirement. In fact, our natural tendency is to think very short term. And this is where the problem starts. On a day-to-day basis shares are down almost as much as they are up. See the next chart. So, day-to-day, it’s pretty much a coin toss as to whether you will get good news or bad when you tune in for the nightly finance update.
But if you just look monthly and allow for dividends, the historical experience tells us you will only get bad news around a third of the time. And if you only look each year, you will only get negative news 20% of the time for Australian shares and 27% of the time for US shares. And if you look just once a decade, positive returns have been seen 100% of the time for Australian shares and 82% for US shares. So, while it’s hard given the bombardment of financial news these days it makes sense to look at your returns less because then are you more likely to get positive news and less likely to make rash decisions or end up adopting an investment strategy that it too cautious.

Source: ASX, Bloomberg, RBA, REIA, AMP
This can also be demonstrated in the following charts. On a rolling 12 month ended basis the returns from shares bounce around all over the place versus cash & bonds.
However, over rolling ten-year periods, shares have invariably done better, although there have been some periods where returns from bonds and cash have done better, albeit briefly.
Source: ASX, Bloomberg, RBA, AMP
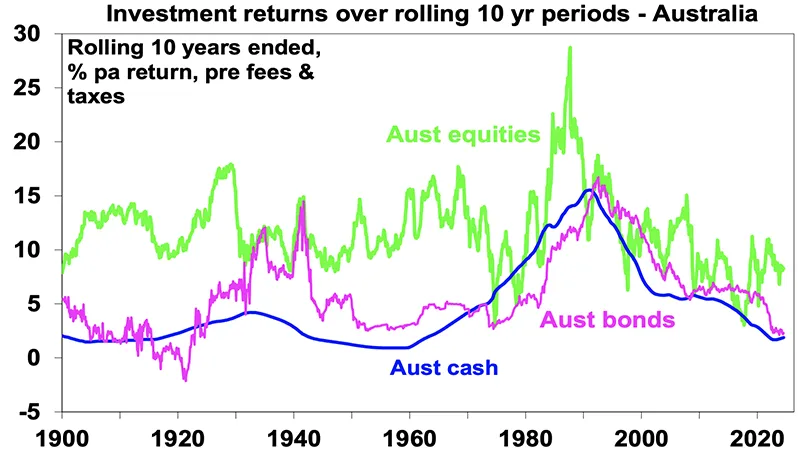
Source: ASX, Bloomberg, RBA, AMP
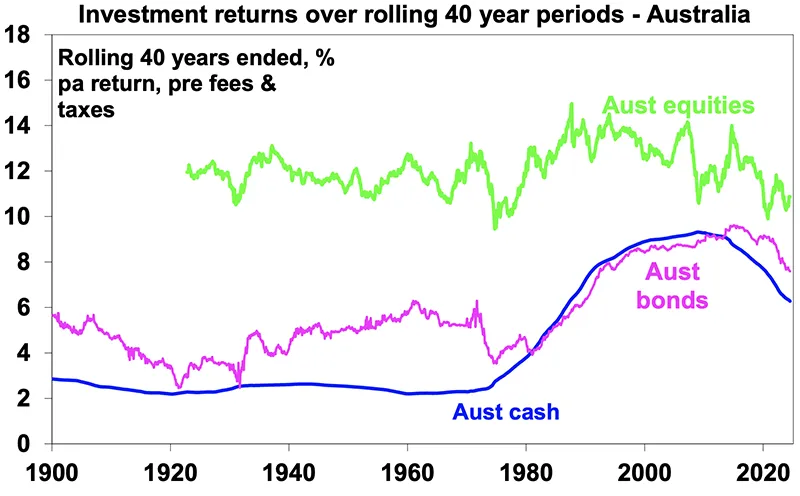
Pushing the horizon out to rolling 20-year periods, returns from shares have almost always done even better, although a surge in cash and bond returns after the very high interest rates of the late 1970s/1980s saw the gap narrow for a while. Over rolling 40-year periods – the working years of a typical person – shares have always done better.
Source: ASX, Bloomberg, RBA, AMP
This is consistent with the basic proposition that higher short-term volatility from shares (often around periods of falling profits & a risk that companies go bust) is rewarded over the long term with higher returns.
But why not try and time short-term market moves?
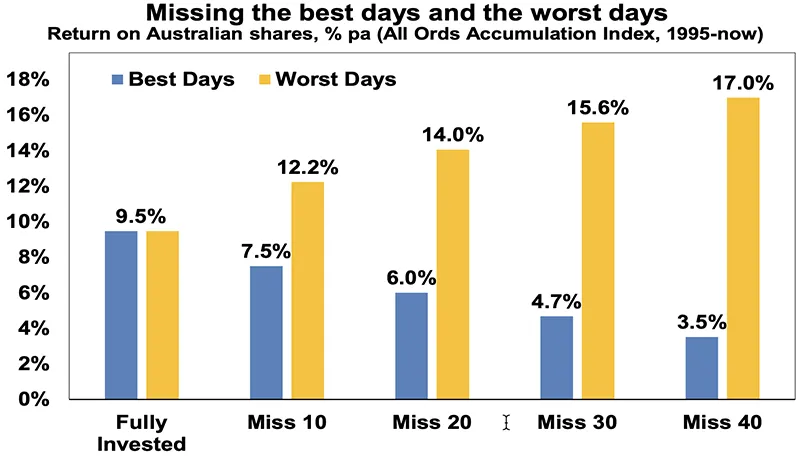
The temptation to do this is immense. With the benefit of hindsight many swings in markets like the tech boom and bust, the GFC and the plunge and rebound in shares around the COVID pandemic look inevitable and hence forecastable and so it’s natural to think “why not give it a go?” by switching between cash and shares within your super to anticipate market moves. Fair enough. But without a tried and tested market timing process, trying to time the market is difficult. A good way to demonstrate this is with a comparison of returns if an investor is fully invested in shares versus missing out on the best (or worst) days. The next chart shows that if you were fully invested in Australian shares from January 1995, you would have returned 9.5% pa (with dividends but not allowing for franking credits, tax and fees).
If by trying to time the market you avoided the 10 worst days (yellow bars), you would have boosted your return to 12.2% pa. And if you avoided the 40 worst days, it would have been boosted to 17% pa! But this is really hard, and many investors only get out after the bad returns have occurred, just in time to miss some of the best days. For example, if by trying to time the market you miss the 10 best days (blue bars), the return falls to 7.5% pa. If you miss the 40 best days, it drops to just 3.5% pa.
Source: Bloomberg, AMP
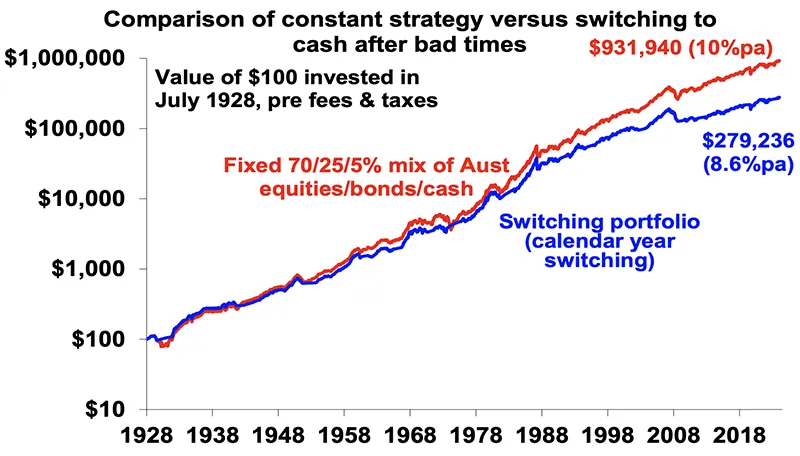
The following chart shows the difficulties of short-term timing in another way. It shows the cumulative return of two portfolios.
- A fixed balanced mix of 70 per cent Australian equities, 25 per cent bonds and five per cent cash;
- A “switching portfolio” which starts off with the above but moves 100 per cent into cash after any negative calendar year in the balanced portfolio & doesn't move back until after the balanced portfolio has a calendar year of positive returns. We have assumed a two-month lag.
Source: ASX, Bloomberg, RBA, AMP
Over the long run the switching portfolio produces an average return of 8.6% pa versus 10% pa for the balanced mix. From a $100 investment in 1928 the switching portfolio would have grown to $279,236, but the constant mix would have ended more than 3 times bigger at $931,940.
Key messages
First, while shares and growth assets have periods of short-term underperformance versus cash & bonds they provide superior long-term returns. So, it makes sense for super to have a high exposure to them.
Second, switching to cash after a bad patch is not the best strategy for maximising wealth over time. In fact, it can just lock in losses.
Third, the less you look at your investments the less you will be disappointed. This reduces the chance of selling at the wrong time.
The best approach is to recognise that super and shares are long-term investments and adopt a long-term strategy to suit your circumstances - in terms of your age, income, wealth and risk tolerance.
Finally, anything that cuts your super balance early on can cut your super at retirement a lot. Eg, a $20,000 withdrawal from super at age 30 - say for a dental expense - can cut your super at age 67 by around $74,000 (in today’s dollars) due to the loss of compounding returns on that amount (using the assumptions in the ASIC MoneySmart Super calculator).
Bill Bracey
CEO & Founder of Sydney Financial Planning
Does your wealth creation strategy have the right mix of growth & assets?
Speak with one of our Financial Planners about the best approach for your circumstances, either book a meeting or get in contact with us on 02 9328 0876.
This article was prepared by Dr Shane Oliver with opening and closing summary by William Bracey - CEO & Senior Financial Planner from Sydney Financial Planning. Dr Shane Oliver who provides economic forecasts and analysis of key variables and issues affecting, or likely to affect, all asset markets. He also provides economic forecasts and analysis of key variables and issues affecting, or likely to affect, all asset markets.
Sydney Financial Planning Pty Ltd (ABN 29 606 413 254), trading as Sydney Financial Planning & Illawarra Financial Planning is an Authorised Representative & Credit Representative of Charter Financial Planning Limited, Australian Financial Services Licensee and Australian Credit Licensee.
This article contains information that is general in nature. It does not take into account the objectives, financial situation or needs of any particular person. You need to consider your financial situation and needs before making any decisions based on this information. If you decide to purchase or vary a financial product, your financial adviser, and other companies within the AMP Group may receive fees and other benefits. The fees will be a dollar amount and/or a percentage of either the premium you pay or the value of your investments. Please contact us if you want more information. If you no longer wish to receive direct marketing from us you may opt out by contacting Sydney Financial Planning . You may still receive direct marketing from AMP as a product issuer, bringing to your attention products, offerings or other information that may be relevant to you. If you no longer wish to receive this information you may opt out by contacting AMP on 1300 157 173.